Creating the Graphs
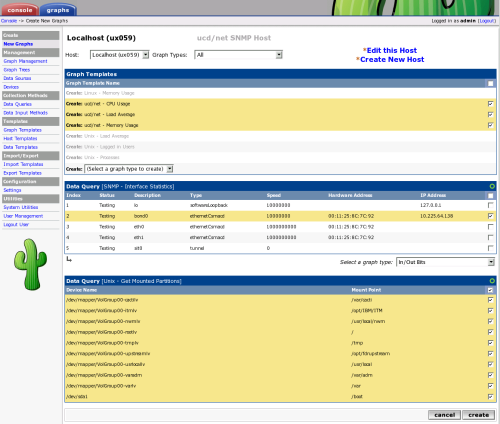
Now that you have created some devices, it is time to create graphs for these devices. To do this, select the New Graphs menu option under the Create heading. If you're still at the device edit screen, select Create Graphs for this Host to see a screen similar to the image pictured below.
The dropdown menu that contains each device should be used to select the host that you want to create new graphs for. The basic concept to this page is simple, place a check in each row that you want to create a graph for and click Create.
If you are creating graphs from inside a "Data Query" box, there are a few additional things to keep in mind. First is that you may encounter the situation as pictured above with the "SNMP - Interface Statistics" data query. If this occurs you may want to consult the section on debugging data queries to see why your data query is not returning any results. Also, you may see a "Select a graph type" dropdown box under some data query boxes. Changing the value of this dropdown box affects which type of graph Cacti will make after clicking the Create button. Cacti only displays this dropdown box when there is more than one type to choose from, so it may not be displayed in all cases.
Once you have selected the graphs that you want to create, simply click the Create button at the bottom of the page. You will be taken to a new page that allows you to specify additional information about the graphs you are about to create. You only see the fields here that are not part of each template, otherwise the value automatically comes from the template. When all of the values on this page look correct, click the Create button one last time to actually create your graphs.
If you would like to edit or delete your graphs after they have been created, use the Graph Management item on the menu. Likewise, the Data Source menu item allows you to manage your data sources in Cacti.
